
Module: Production in Numbers

Quickly check your production statistics!
The "Production in Numbers" module is a key tool in Prodio that provides a detailed insight into production statistics. Displayed as the first section in the dashboard, it gives you quick access to crucial data in one place. It is perfect for daily analysis of efficiency and productivity.
What Information Can You Find in the "Production in Numbers" Module?
The module is divided into two main sections (you can switch between daily and monthly summaries using the slider next to "Monthly Summary." If you want to view data from another period, use the "Filter" button to select a date range).
Time Comparison – Analysis of work time usage.
Performance Indicators (%) – Assessment of efficiency and productivity.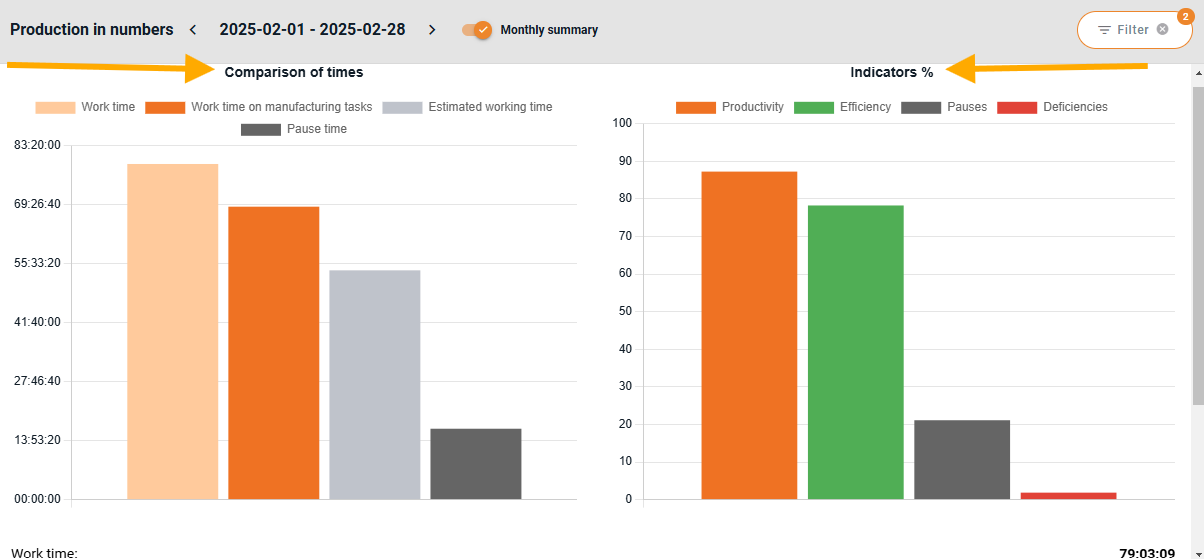
📊 Time Comparison
This section includes a bar chart that illustrates different time categories:
Work Time (Light Orange) – The total time spent at work.
Work Time on Manufacturing Tasks (Dark Orange) – Time spent on manufacturing tasks.
Estimated Working Time (Gray) – The expected time required to complete tasks (according to the plan).
Break Time (Dark Gray) – The time spent on breaks.
📈 Performance Indicators (%)
This section presents percentage-based metrics for various categories:
Productivity (Orange) – The percentage of time spent on manufacturing tasks compared to the total work time.
Efficiency (Green) – A comparison of planned time versus actual work time.
Pauses (Dark Gray) – The percentage of time spent on breaks relative to total work time.
Deficiencies (Red) – The percentage of defective products in relation to total production.
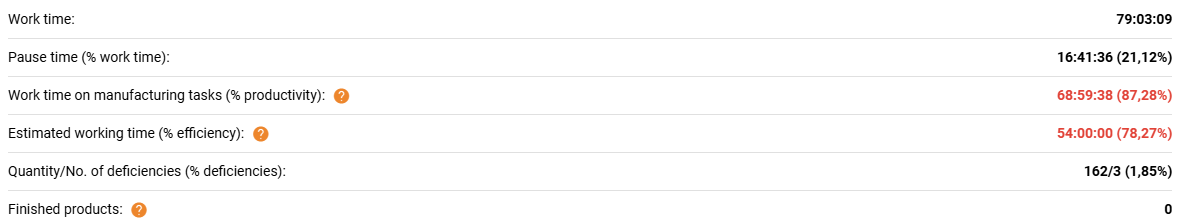
📋 Detailed Numerical Data
Below the charts, you'll find detailed numerical statistics, such as:
Work Time – The total hours logged at work.
Pause Time – The percentage of break time in total work time.
Work Time on Manufacturing Tasks – The actual time spent on production.
Estimated Working Time – The expected time required to complete tasks (click the question mark icon for more details).
Quantity/No. of deficiencies– The number of completed products without defects versus defective products.
Finished Products – The number of fully completed products.
The bar colors and percentage values help quickly identify areas for improvement, such as excessive break times or low productivity levels.
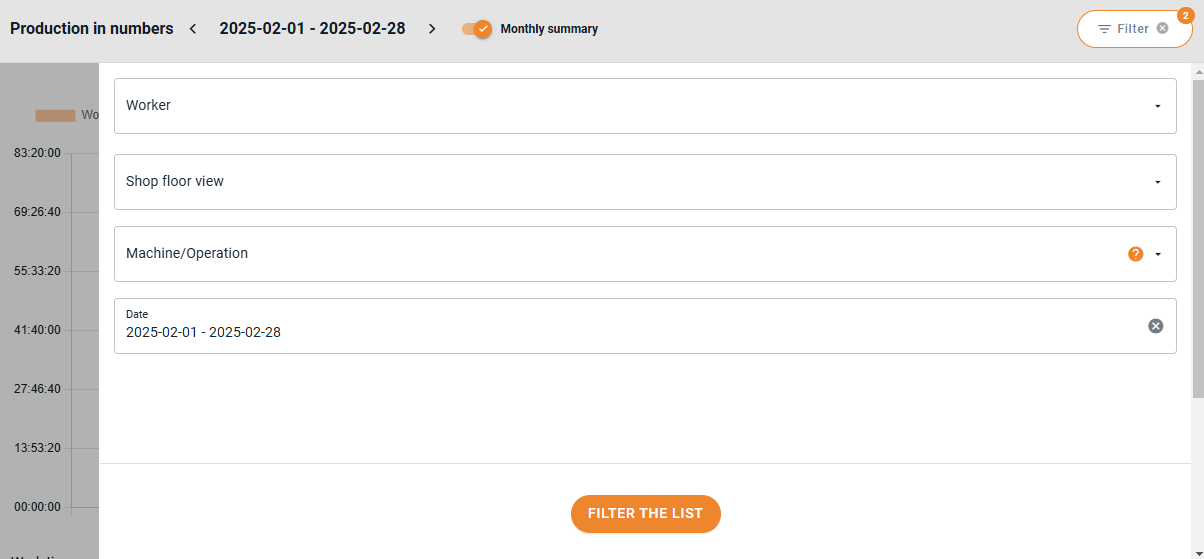
🔎 Filtering Data in the "Production in Numbers" Module
In the top-right corner, you'll find the "Filter" button, allowing you to refine your data selection. You can filter by:
Worker– Analyze individual performance.
Shop Floor View – Review data from specific registration points.
Machine/Operation – Monitor how efficiently resources are used.
Date – Select a specific period, such as a day, a week, or a month.
Example Use Cases for Filters:
➡️ Want to evaluate a specific worker's productivity for the past week? Select their name and set the date range.
👋 High five from the Prodio team!
Prodio – The most convenient way to plan manufacturing and control work online.
High five 🙋♀️ - team Prodio!
Prodio is a user friendly production planning software for small manufacturers